The Path to College Graduation
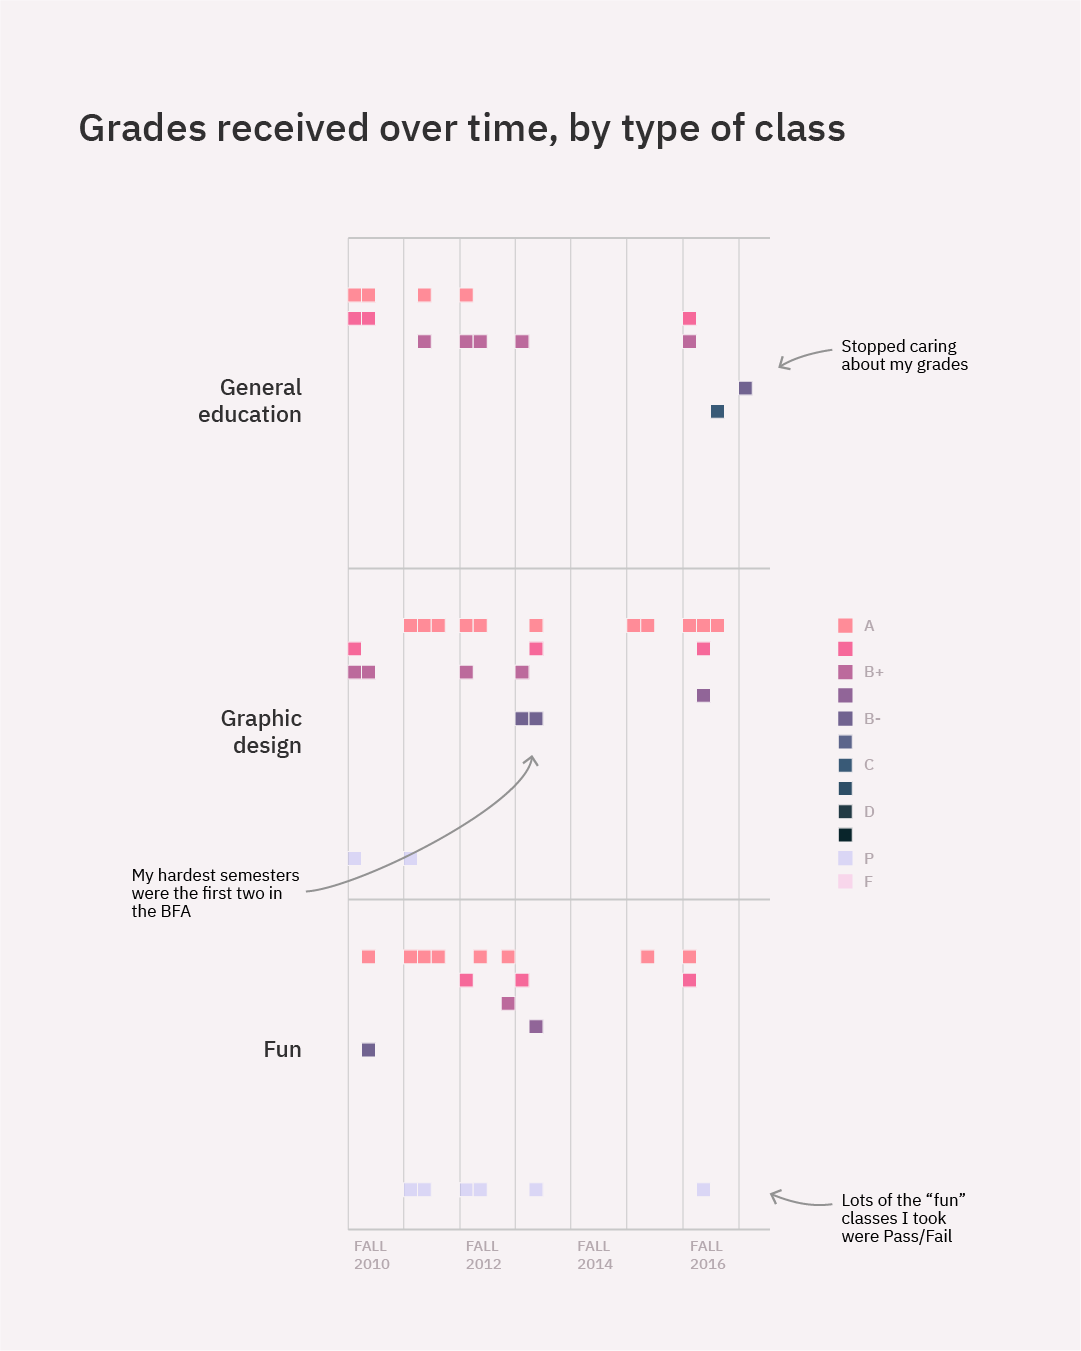
It took me seven years to complete my undergraduate degree. Students each have a unique path and journey through higher education. This is a visual exploration of my story. There are stories in the data — things that happened in my life that affected my education. These charts visualize my (many) years as a college student.
I submitted a waterfall version of this chart to the Storytelling with Data montly challenge.
Instagram story︎
Process︎
Medium article︎
Made using Processing and Illustrator, May 2018
I submitted a waterfall version of this chart to the Storytelling with Data montly challenge.
Instagram story︎
Process︎
Medium article︎
Made using Processing and Illustrator, May 2018